Statistics 2006-2007 – see down this page
Telework Information Society Statistics from Mar-06 – Jun-07
Information Society Statistics
8-Mar-06
Noel Hodson, SW2000 Telework Studies.
Telework Productivity, Costs & Benefits (worked example below)
|
SW2000 Telework Studies www.noelhodson.com |
2005 2005 |
2005 2005 |
|
|
||
|
|
DISPERSED TEAMS |
TELEWORK CLIENTS |
||||
|
BUSINESS TAX PLANNING WHAT-IF? FORECASTS |
OFFSHORE & TAXES |
|||||
|
|
|
|
|
|
|
|
|
SOCIETAL PAPERS Politics, Economics & Hobby-Physics |
||||||
|
BOOKS, POEMS Creative Writing, Art. |
Go to archived statistics – pre 2004
By Noel Hodson, director of SW2000 Telework Studies
CONTENTS
British Sex on the Net – Time Magazine – 12
June 06
UK On-Line –
Richard `Adams in the Guardian – 22 May 06
EU teleworkers
1999-2005 - Empirica – 8 March 06
UK teleworkers
2005 – 8 March 06
US telework
statistics 2005 – posted 27 Feb 06.
The Oxford
Internet Survey May 2005. Extracts 17 Oct 2005.
Defining US
Poverty – 81 million poor – 17 Oct 05.
GOOGLING
MICROSOFT – 26th August 05
Where to go on
vacation – labour rates around the world – 26th August 05
UK Flexi-Work –
Telework, Term-Time, Part-Time etc – 5th July 2005.
Pornography on
the Net – 17th May 05
E-Commerce,
Internet Trading and Video-Conferencing – 26th April 05
Annual
Advertising Spend – UK – 2004
Spam and Junk
Mail – 3rd Feb 2005.
USA slips back in
the broadband race – Friday 3 September 2004.
Wrinkly old World
– Population shifts 1990-2090 – posted 19 July 2004.
US Government
Departments – Teleworkers reported in June 2004.
TIME IS MONEY -
What you contribute to your company
TIME IS MONEY -
Employee Value in some UK corporations
British Sex on the Net – Time Magazine – 12 June 06
These statistics support the findings in Brett Kahr’s report below.
Pornography on the Net – 17th May 05
|
TIME MAGAZINE 12th June 2006 published more of
their enigmatic stats: |
|||||||
|
9 |
million
British men downloaded pornography from the Internet, last year. |
|
|
||||
|
1.4 |
million
British women -ditto- |
|
|
|
|
|
|
|
|
Our assumptions |
|
|
|
|
|
|
|
Population of the |
60,000,000 |
|
|
|
|
|
|
|
Lifespan |
72 |
years |
|
|
|
|
|
|
so born PER YEAR |
833,333 |
|
|
|
|
|
|
|
50% are male and 50% female |
50% |
50% |
|
|
|
|
|
|
|
|
|
|
|
|
|
|
|
Men who downloaded images in 2005 |
9,000,000 |
1,400,000 |
Women who
downloaded images in 2005 |
|
|||
|
Males born per year |
416,667 |
416,667 |
Females born per
year |
|
|
||
|
|
AGE |
AGE |
|
|
|
|
|
|
Interested in sex with access to
Internet from |
14 |
14 |
Interested in
sex with access to Internet from |
||||
|
to |
80 |
54 |
to |
|
|
|
|
|
years |
66 |
40 |
years |
|
|
|
|
|
|
|
|
|
|
|
|
|
|
Adult sexual males |
27,500,000 |
16,666,667 |
Adult sexual
females |
|
|
|
|
|
Males with private/home access to the
internet? |
33% |
20% |
Women with
private/home access to the internet? |
||||
|
Men with private access |
9,075,000 |
3,333,333 |
Women with
private access |
|
|
||
|
Use pornography |
100% |
42% |
Use pornography |
|
|
|
|
|
|
|
|
|
|
|
|
|
|
|
|
|
|
|
|
|
|
|
|
|
|
|
|
|
|
|
UK On-Line – Richard `Adams in the Guardian – 22 May 06
These statistics were published by Technology Guardian on the 15th September 2005.
|
ITEM |
THEN |
NOW |
|
|
E-Bay |
In 2000 there were £43 million of transactions. |
Forecast for 2005 is £4 billion or 93 times
more. |
|
|
Digital
TV |
In 2000 15% of homes had digital TV |
In 2005 61.9% have digital TV |
|
|
Hours
shopping |
|
1 of every 5 hours shopping is now on the
Internet |
|
|
Video
Games 56%
of users are aged from 24 to 44 |
In 1996 £350M of videogames were sold in the |
In 2004 £1.2 billion of Videogames were sold.
3.5 times more than in 1996. |
|
|
Mobile
Phones |
2000 There were 40 million |
2004 There were 60 million, or most of the
population. |
|
|
Broadband
Connections |
2001 1.4M |
2004 6.2M (about 1/3rd of households) |
|
|
Digital
Cameras |
2001 935,000 |
2006 forecast 5,964,348 |
|
EU teleworkers 1999-2005 - Empirica – 8 March 06
Werner B Korte,
Director of Empirica,
|
|
Teleworkers
as % of total workforce 1999 2005 |
|||||||||||||||||||||||||||||||||
|
% |
|
FIN |
|
NL |
|
SW |
|
DK |
|
D |
|
|
|
EU10 |
|
IRL |
|
I |
|
E |
|
F |
|
|||||||||||
|
35 |
|
|
|
|
|
|
|
|
|
|
|
|
|
|
|
|
|
|
|
|
|
|
|
|
|
|
|
|
|
|
|
|
|
|
|
30 |
|
|
|
|
|
|
|
|
|
|
|
|
|
|
|
|
|
|
|
|
|
|
|
|
|
|
|
|
|
|
|
|
|
|
|
25 |
|
|
29 |
|
|
25 |
|
|
24 |
|
|
|
|
|
|
|
|
|
|
|
|
|
|
|
|
|
|
|
|
|
|
|
|
|
|
20 |
|
17 |
|
|
|
|
|
|
|
|
|
19 |
|
|
|
|
|
|
|
|
|
|
|
|
|
|
|
|
|
|
|
|
|
|
|
15 |
|
|
|
|
15 |
|
|
15 |
|
|
11 |
|
|
|
13 |
|
|
12 |
|
|
11 |
|
|
|
|
|
|
|
|
|
|
|
|
|
|
10 |
|
|
|
|
|
|
|
|
|
|
|
|
|
6 |
|
|
8 |
|
|
6 |
|
|
|
8 |
|
|
7 |
|
|
|
|
|
|
|
|
5 |
|
|
|
|
|
|
|
|
|
|
|
|
|
|
|
|
|
|
|
|
|
|
4 |
|
|
4 |
|
|
|
5 |
|
|
5 |
|
|
0 |
|
|
|
|
|
|
|
|
|
|
|
|
|
|
|
|
|
|
|
|
|
|
|
|
|
|
|
|
3 |
|
|
3 |
|
|
|
|
|
|||||||||||||||||||||||||||||||||
|
|
|
|
|
|
|
|
|
|
|
|
|
|
|
|
|
|
|
|
|
|
|
|
|
|
|
|
|
|
|
|
|
|
|
|
|
|
|
Regular and supplementary teleworkers as
% of workforce - as presented in 2001 |
||||||||||||||||||||||||||||||||
|
|
|
R |
S |
|
R |
S |
|
R |
S |
|
R |
S |
|
R |
S |
|
R |
S |
|
R |
S |
|
R |
S |
|
R |
S |
|
R |
S |
|
R |
S |
|
|
% |
|
10.8 |
6.0 |
|
8.3 |
6.3 |
|
8.0 |
7.2 |
|
6.6 |
3.9 |
|
4.4 |
1.6 |
|
4.8 |
2.8 |
|
4.1 |
2.0 |
|
1.9 |
2.6 |
|
2.9 |
0.7 |
|
2.3 |
0.6 |
|
2.0 |
0.8 |
|
UK
Extract from a BBC report
6 Oct 2005, which errs on (1) SW2000 Telework Studies counted
Rising numbers
Teleworkers were first counted back in 1997.
|
|
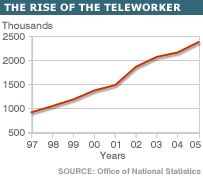
Then, just 921,000 people said they used telephones
or computers to let them work at home or to use their homes as a base for work.
Of these, 737,000 said they couldn't in fact work
like this without both a computer and phone.
But by early 2005 the number of teleworkers had
shot up to 2,377,000.
And most - 2.1 million - said they depended on
their digital technology to work from home.
As a result all teleworkers now make up 8% of the
working population, up from 4% in 1997.
However, Alexandra Jones of the Work Foundation
says: "It's not as big a rise as some people were once predicting during
the hype of the dot-com boom."
US telework statistics 2005 – posted 27 Feb 06.
An
extract, courtesy of ITAC. For the full report go to the ITAC site:
http://www.workingfromanywhere.org/news/pr100405.htm
Research conducted for ITAC by The Dieringer Research Group as part of
Dieringer’s 2005 American Interactive Consumer Survey.
The national survey was conducted from August 15 – September 1, 2005.
The survey asked respondents to check up to 13 different locations where they
may have conducted work in the past month. The survey found that out of 135.4
million American workers:
- 45.1 million worked from home,
- 24.3 million people worked at client’s or customer’s place of
business,
- 20.6 million in their car,
- 16.3 million while on vacation,
- 15.1 million at a park or outdoor location, and
- 7.8 million while on a train or airplane
Among the 45.1 million Americans working from home (33.3% - NB – This will include traditional
non-computer working, usually simple, piece-work; addressing envelopes,
wrapping gifts etc ), the average number of locations they work from
is 3.4.
This survey demonstrates that millions of Americans are embracing
telework – the ability to work from anywhere. Other terms relating to telework
include telecommuting (work at home), virtual work and mobile work.
“The ability for people to work from anywhere is attributed in part to
increasing availability of portable computer and high-speed communication
technologies,“ said Robert Smith, Director of ITAC. “For example, the use of
broadband in the home by teleworkers increased by over 60% during the past year
resulting in 25.6 million home-based teleworkers with high speed access.”
UK
& EU Houses - 4 Nov 2005 .
|
The mobility of Teleworking and advanced telecoms has
evened out price differentials between |
||||
|
|
||||
|
40 years increase 51
times. (Retail prices have risen x 13) |
Average home price
today £170,000 |
First time buyers pay
£157,000 |
House Owning |
|
|
|
92% |
|||
|
Homes 2004 |
25,000,000 |
|
|
90% |
|
New homes built 2003/04 |
190,067 |
|
|
83% |
|
|
83% |
|||
|
Mortgaged homes for
rent 2004 |
526,000 |
|
|
77% |
|
|
71% |
|||
|
Total Value |
£3,221,000,000 |
55% of national
assets. |
|
71% |
|
Mortgage debt AUG 2005 |
£932,000,000 |
|
|
64% |
|
|
57% |
|||
|
|
|
|
15
nation EU Average |
74% |
The
Oxford 17 Oct 2005 .
|
|
|||
|
|
|
|
|
|
Sample – 2005
– Random sample across |
|||
|
|
|
|
|
|
INTERNET USERS |
UK 2005. |
|
|
|
Broadband at Home |
59% |
|
|
|
Internet at Home – persons |
61% |
|
|
|
Internet at Home - houses |
36% |
|
|
|
Internet via telephone |
87% |
|
|
|
Homes with computers |
66% |
|
|
|
Computer used daily at home |
46% |
|
|
|
Internet users with a mobile phone |
85% |
|
|
|
Internet users with email |
92% |
|
|
|
Made your own webpage? NO |
82% |
|
|
|
Written a computer programme NO |
85% |
|
|
|
|
|
|
|
|
INTERNET USES |
|
|
|
|
Check E-Mail |
92% |
|
|
|
News, information, local events |
66% |
|
|
|
Health information |
25% |
|
|
|
Book and buy travel tickets |
71% |
|
|
|
Download – Music |
54% |
Downloads have soared since May 05. |
|
|
Download – Video |
33% |
Onto Ipod and other MP3 players. |
|
|
Download – Radio |
33% |
|
|
|
Look for facts/research |
78% |
|
|
|
Bank online |
45% |
|
|
|
Pay bills on line |
39% |
|
|
|
Invest on line |
10% |
|
|
|
Buy products on line |
74% |
|
|
|
WHY? - Wider choice of goods |
54% |
|
|
|
Lower prices |
53% |
|
|
|
Distance Learning (IDLE?) |
21% |
|
|
|
Used an E-Government Service YES |
39% |
|
|
|
In favour of E-voting |
43% |
|
|
|
News on-line – never printed YES |
20% |
|
|
|
Pay for news on-line YES |
1% |
|
|
|
Search by specific web address? |
60% |
|
|
|
Search by search engine query? |
60% |
|
|
|
Met new friends on-line? YES |
20% |
|
|
|
Computers important in daily life YES |
63% |
|
|
|
Is Internet a threat to privacy? YES |
49% |
|
|
|
BIG BROTHER |
|
|
|
|
Who should control children’s access? |
|
|
|
|
PARENTS |
95% |
|
|
|
GOVERNMENT |
46% |
|
|
|
|
|
|
|
|
Users with poor education |
27% |
|
|
|
Users with good education |
83% |
|
|
|
Males who use the internet |
63% |
|
|
|
Females who use the internet |
57% |
|
|
|
Pupils – school age - who use internet |
97% |
|
|
|
Retirees – (no job 55+) who use internet |
30% |
|
|
|
SEX |
|
|
|
|
In this UK OxIS survey 13% access
sex sites – but the UK survey below, 17th May 05, Pornography on
the Net, shows 87% of men and 56% of women have accessed sex sites – the survey concluded that sexual curiosity
had been a significant motive for getting on-line. Maybe it’s the way the
question is asked? Or, perhaps more likely, sex-sites occupy 13% of the total
time on-line of 87% of men and 56% of women? Theories on a postcard please
and emailed to OII. |
|||
|
|
|
|
|
Defining
US Poverty – 81 million poor – 17 Oct 05.
|
|
Family of
4 |
Family of
3 |
Single
person |
|
Poverty
income |
$19,307 a
year |
$15,067 a
year |
$9,645 a
year |
|
|
|||
|
Below the
Line |
|
33.6% |
|
|
|
|
28.8% |
|
|
|
|
28.3% |
|
|
|
|
28.1% |
|
|
|
|
27.8% |
|
|
|
|
26.4% |
|
|
|
|
26.0% |
|
|
|
|
25.9% |
|
|
|
|
24.9% |
|
|
|
|
24.6% |
Population |
|
|
|
274.4 |
295,734,130 |
|
Simple Average |
|
27.4% |
81,031,151 |
|
Median |
$44,400 a year |
|
|
|
Source –
The Guardian – |
|||
GOOGLING
MICROSOFT – 26th August 05
“War”
and a “battle” has been declared between Microsoft and Google – according to
the media. Here are a few comparisons by Jason Rodrigues and journalists Owen
Gibson and Richard Wray at the Guardian,
|
|
GOOGLE |
MICROSOFT |
|
|
|
|
|
|
|
Market
Capitalisation |
$78 billion |
|
|
|
Market
penetration Global |
|
95% |
|
|
Market
penetration |
60.0% |
10% |
MSN |
|
Market
penetration |
36.5% |
15.5% |
MSN |
|
Company
worth |
$8.6 billion |
$59.9 billion |
|
|
Online
advertising world $15B |
$3.2 billion |
|
|
|
Founders
are worth |
$20 billion |
$46 billion |
Bill
Gates only |
|
Staff
worldwide |
4,183 |
57,000 |
|
|
Net
Income (profits) annually |
$399 million |
$12,254 million |
|
|
|
|
|
|
But then Bill has many more salaries to pay:
57,000 people x say, $75,000
= $4,275,000,000 is $4.27 billion
Where
to go on vacation – labour rates around the world – 26th August 05
|
|
US$ |
|
|
European
Union |
24.1 |
13.4 |
|
|
22.0 |
12.2 |
|
|
20.4 |
11.3 |
|
|
20.1 |
11.1 |
|
|
15.0 |
8.3 |
|
|
10.3 |
5.7 |
|
|
7.4 |
4.1 |
|
|
6.2 |
3.4 |
|
|
5.8 |
3.2 |
|
|
5.5 |
3.0 |
|
|
4.7 |
2.6 |
|
|
2.7 |
1.5 |
|
|
2.5 |
1.4 |
|
|
2.1 |
1.2 |
|
|
1.5 |
0.8 |
|
|
1.1 |
0.6 |
|
|
0.7 |
0.4 |
|
|
0.5 |
0.2 |
|
|
0.3 |
0.2 |
|
Average |
8.0 |
4.4 |
(source
Sunday Times UK from US Department of Labor, Standard Chartered Bank.)
UK
Flexi-Work – Telework, Term-Time, Part-Time etc – 5th July 2005 .
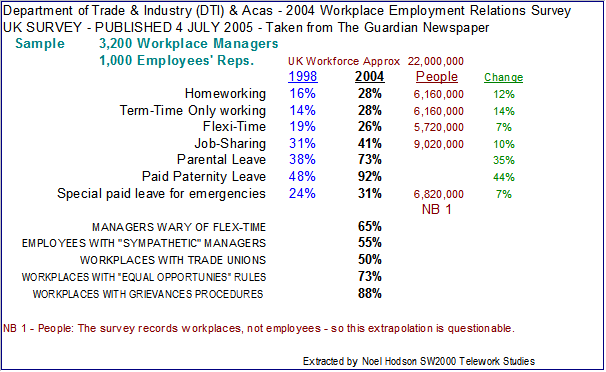
Full
text at GuardianUnlimited.co.uk – search for “Nine-to-five in decline as
Pornography
on the Net – 17th May 05
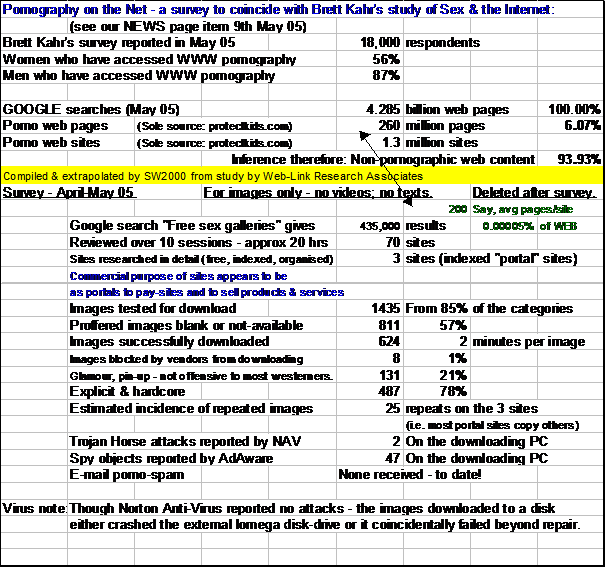
Accompanying News Item at:
http://www.noelhodson.com\index_files\NEWS.htm
E-Commerce,
Internet Trading and Video-Conferencing – 26th April 05
Annual
Advertising Spend – UK
Source – Interactive
Advertising Bureau
3.9% Internet - £653.4M
5.0% Outdoor
6.4% Directories
14.6% Direct Mail
19.3% Press Classified
22.1% Press Display
23.9% Television
0.9% Cinema
3.8% Radio
99.9%
Spam
and Junk Mail – 3rd Feb 2005 .
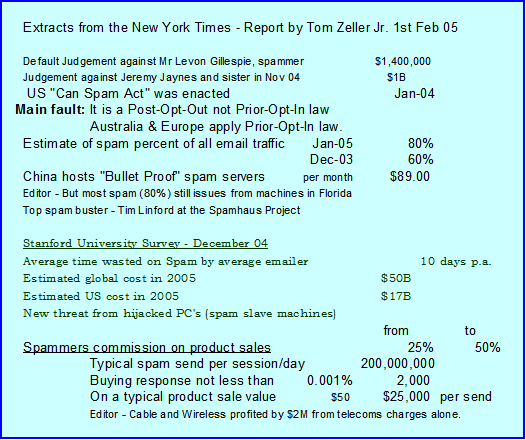
USA Friday 3 September 2004 .
Wrinkly
old World – Population shifts 1990-2090 – posted 19 July 2004 .
Interactive EXCEL download version free on the home page – www.noelhodson.com
|
|
|
|
|
|
|
|
|
|
|
|
|
|
|
|
|
|
|
|
|
|
|
|
|
Population Shift in 20 year stages - With implications for
housing |
|
|
|
||||
|
|
|
|
Copyright 2004 Noel Hodson www.noelhodson.com |
|
|
|
|||
|
|
|
|
|
|
Change the variables in the coloured cells e.g. |
1.6 |
Births per family |
|
|
|
|
|
20 |
years per generation. |
|
|
FF's 1990 |
124,137,780 |
20% |
|
|
|
EU & US Total Population |
620,667,800 |
1990 |
av lifespan |
All 65+ 1990 |
86,404,300 |
14% |
|
|
|
|
Deaths one year |
|
8,620,386 |
1991 |
72 |
|
2010 |
|
|
|
|
Deaths in 20 years |
172,407,722 |
90-2010 |
|
Fertile Females 15-40 |
114,582,601 |
17% |
|
|
|
|
Births/generation |
1.7 |
211,034,226 |
90-2010 |
|
All 65+ |
100,037,962 |
15% |
|
|
|
Total population |
2010 |
659,294,304 |
2010 |
|
|
|
|
|
|
|
Young deaths |
10.00% |
|
|
|
|
|
|
|
|
|
Deaths in 20 years |
180,628,576 |
2011-30 |
73 |
|
2030 |
|
|
|
|
|
Births/generation |
1.6 |
183,332,162 |
2011-30 |
|
Fertile Females 15-40 |
46,291,371 |
7% |
|
|
|
Total population |
2030 |
661,997,890 |
2030 |
|
All 65+ |
114,971,670 |
17% |
|
|
|
Young deaths |
9.00% |
|
|
|
|
|
|
|
|
|
Deaths in 20 years |
176,532,771 |
2031-50 |
75 |
|
2050 |
|
|
|
|
|
Births/generation |
1.5 |
69,437,056 |
2031-50 |
|
Fertile Females 15-40 |
18,111,499 |
3% |
|
|
|
Total population |
2050 |
554,902,175 |
2050 |
|
All 65+ |
132,602,518 |
24% |
|
|
|
Young deaths |
8.00% |
|
|
|
|
|
|
|
|
|
Deaths in 20 years |
144,130,435 |
2051-70 |
77 |
|
2070 |
|
|
|
|
|
Births/generation |
1.4 |
155,377,891 |
2051-70 |
|
Fertile Females 15-40 |
23,432,981 |
4% |
|
|
|
Total population |
2070 |
566,149,631 |
2070 |
|
All 65+ |
149,475,804 |
26% |
|
|
|
Young deaths |
7.00% |
|
|
|
|
|
|
|
|
|
Deaths in 20 years |
143,329,021 |
2071-90 |
79 |
|
2090 |
|
|
|
|
|
Births/generation |
1.3 |
147,203,908 |
2071-90 |
|
Fertile Females 15-40 |
23,455,094 |
4% |
|
|
|
Total population |
2090 |
570,024,519 |
2090 |
|
All 65+ |
168,720,042 |
30% |
|
|
|
Young deaths |
6.00% |
|
|
|
|
|
|
|
|
|
|
All deaths are not affected by Young Deaths, which only alter
the numbers of 65 + |
|
|
|||||
|
|
|
|
|
|
|
|
|
|
|
|
|
|
|
|
|
|
|
|
|
|
US
Government Departments – Teleworkers reported in June 2004.
MESSAGE FROM THE DIRECTOR
I am pleased to present the Office of Personnel Management’s
(OPM) 2004 report on the status of Telework in the Federal Government. This report summarizes findings from our 2003
agency telework survey and describes the major telework promotion activities
undertaken by OPM in partnership with the General Services Administration
(GSA).
For the third consecutive year, the number of telework-eligible
and teleworking employees continues to grow.
Governmentwide, 751,844 Federal employees representing 43 percent of the
Federal workforce were telework-eligible in 2003, compared with 625,313 Federal
employees representing 35 percent of the Federal workforce in 2002. This represents an increase of 20 percent, or
an additional 126,531 identified telework-eligible positions. The actual number of employees teleworking in
2003 was 102,921, representing a 14 percent increase over the number of
teleworkers in 2002. Notably, since
April 2001, the number of teleworkers has increased from 53,389 to 102,921, an
increase of 93 percent in the size of the telecommuting workforce.
Initially, the thrust of developing telework as an
employee/employer option centered on environmental goals, enhanced quality of
life issues, and recruitment and retention issues. In 2001, President George W. Bush added
telework to his New Freedom Initiative, which focused on expanding job
opportunities for people with disabilities.
In the aftermath of September 11, telework has attracted greater
attention by Federal managers as an essential consideration in agencies’
emergency planning efforts, whether for snow storms, other natural disasters,
or terrorist attacks. Telework has been
integrated into the Federal Government’s Continuity of Operations Plans (COOP),
and OPM is laying the groundwork for including telework in its evaluation of
agency human resources programs.
For the 2003 report, OPM revised the telework survey instrument
to sharpen and clarify definitions and to bring the survey in line with OPM’s
strategic focus for telework. Our focus
includes recognizing the necessity of telework in emergency planning, the
importance of a regularly scheduled and experienced cadre of teleworkers, and
the use of occasional telework as a trial assessment period. We also emphasize the necessity for Federal
agencies to take responsibility for meeting statutory telework obligations.
We conclude that telework is growing steadily in the Federal
Government, whether measured by the number of employees teleworking or by the
growing maturity of agency telework programs.
Telework is progressively moving into the mainstream as an expected part
of an effective agency’s personnel strategy, rather than as a “special” program
needing a great deal of external support.
Kay Coles James - Director
|
|
US Gov Agency - June 2004. |
All Employees |
Eligible |
All Telewor-kers |
Core Telew-orkers |
Situational Teleworkers |
Days Core TWRKS |
Days Sit TWRKS |
Teleworkers in DC Metro Area |
Teleworkers Outside DC Metro Area |
|
1 |
Agency for Int Development |
2,174 |
1,138 |
167 |
24 |
143 |
4 |
1 |
167 |
0 |
|
2 |
Appraisal Subcommittee |
7 |
6 |
3 |
3 |
0 |
4 |
0 |
3 |
0 |
|
3 |
Arch and Transport Barriers Compl |
28 |
25 |
18 |
1 |
17 |
12 |
4 |
18 |
0 |
|
4 |
|
603 |
0 |
0 |
0 |
0 |
0 |
0 |
0 |
0 |
|
5 |
Chem Safety & Hazard Invst Bd |
33 |
31 |
0 |
0 |
0 |
0 |
0 |
0 |
0 |
|
6 |
Com for Pur from Blind people |
29 |
14 |
4 |
3 |
1 |
8 |
4 |
4 |
0 |
|
7 |
Commodity Futures Trading Com |
534 |
534 |
50 |
0 |
50 |
0 |
4 |
47 |
3 |
|
8 |
Consumer Product S Com |
452 |
400 |
198 |
193 |
5 |
4 |
5 |
77 |
121 |
|
9 |
Corp for Nat & Community Service |
585 |
585 |
34 |
11 |
23 |
4 |
5 |
31 |
3 |
|
10 |
Court Services and Offender S A |
1,000 |
939 |
59 |
55 |
4 |
4 |
0 |
54 |
1 |
|
11 |
Def. Nuclear Facilities Safety Bd |
98 |
4 |
4 |
0 |
4 |
0 |
5 |
87 |
7 |
|
12 |
Department of Agriculture |
112,843 |
74,780 |
3,434 |
1,543 |
1,891 |
4 |
2 |
1,607 |
1,827 |
|
13 |
Department of Commerce |
24,353 |
17,871 |
6,921 |
5,798 |
1,123 |
5 |
4 |
6,303 |
329 |
|
14 |
Department of Defense |
672,902 |
150,037 |
13,879 |
4,360 |
9,519 |
5 |
3 |
3,803 |
10,076 |
|
15 |
Department of Education |
4,754 |
2,707 |
1,374 |
174 |
1,200 |
12 |
5 |
755 |
619 |
|
16 |
Department of Energy |
14,519 |
1,437 |
1,437 |
805 |
632 |
3 |
2 |
715 |
722 |
|
17 |
Dept of Health and Human Services |
66,686 |
51,977 |
9,497 |
4,860 |
4,637 |
6 |
4 |
4,512 |
7,164 |
|
18 |
Department of Homeland Security |
53,025 |
25,803 |
392 |
168 |
224 |
23 |
1 |
172 |
806 |
|
19 |
Dept of Housing and Urban Dev. |
10,127 |
487 |
433 |
401 |
32 |
9 |
8 |
68 |
365 |
|
20 |
Department of Interior |
81,144 |
62,598 |
2,038 |
635 |
1,403 |
8 |
4 |
407 |
1,835 |
|
21 |
Department of Justice |
100,400 |
45,895 |
2,029 |
830 |
1,199 |
8 |
3 |
1,966 |
9,327 |
|
22 |
Department of Labor |
16,141 |
15,052 |
5,749 |
4,631 |
1,118 |
16 |
2 |
2,249 |
3,471 |
|
23 |
Department of State |
18,310 |
11,558 |
170 |
117 |
53 |
4 |
1 |
167 |
3 |
|
24 |
Department of Transportation |
58,487 |
27,078 |
2,695 |
1,730 |
965 |
4 |
2 |
1,136 |
1,559 |
|
25 |
Department of Treasury |
108,533 |
43,433 |
30,498 |
20,353 |
10,145 |
7 |
3 |
2,589 |
27,909 |
|
26 |
Department of Veterans Affairs |
230,406 |
124,318 |
1,415 |
1,017 |
398 |
4 |
2 |
0 |
0 |
|
27 |
Environmental Protection Agency |
18,272 |
17,345 |
4,986 |
4,844 |
142 |
|
|
1,913 |
3,073 |
|
28 |
Equal Employment |
2,583 |
1,933 |
769 |
566 |
203 |
0 |
0 |
441 |
1,492 |
|
29 |
Export-Import Bank of the |
420 |
420 |
1 |
1 |
0 |
8 |
0 |
1 |
0 |
|
30 |
Farm Credit Administration |
293 |
293 |
112 |
7 |
105 |
4 |
1 |
46 |
66 |
|
31 |
Federal Communications Com |
2,049 |
2,049 |
611 |
361 |
250 |
5 |
2 |
521 |
93 |
|
32 |
Federal Deposit Insurance Corp |
5,341 |
5,341 |
526 |
453 |
73 |
6 |
1 |
189 |
337 |
|
|
|
|
|
|
|
|
|
|
|
|
|
33 |
Federal Energy Reg Com |
1,218 |
1,142 |
306 |
267 |
39 |
3 |
1 |
264 |
42 |
|
34 |
Federal Housing Finance Board |
106 |
98 |
37 |
9 |
28 |
20 |
3 |
29 |
8 |
|
35 |
Federal Labor Relations Authority |
208 |
130 |
16 |
13 |
3 |
4 |
1 |
5 |
10 |
|
36 |
Federal Maritime Commission |
125 |
125 |
10 |
1 |
9 |
2 |
4 |
10 |
0 |
|
37 |
Federal Med and Con Service |
290 |
254 |
118 |
7 |
111 |
13 |
2 |
17 |
101 |
|
38 |
Federal Retr Thrift Invest. Bd |
100 |
3 |
0 |
0 |
0 |
0 |
0 |
3 |
0 |
|
39 |
Federal Trade Commission |
1,092 |
800 |
25 |
18 |
7 |
6 |
2 |
25 |
0 |
|
40 |
General Services Admin |
12,800 |
11,873 |
2,904 |
1,318 |
1,586 |
6 |
2 |
1,325 |
1,579 |
|
41 |
|
400 |
300 |
55 |
14 |
41 |
4 |
2 |
55 |
0 |
|
42 |
Inter-American Foundation |
49 |
49 |
7 |
5 |
2 |
9 |
2 |
7 |
0 |
|
43 |
Int Boundary and Water Com |
259 |
69 |
1 |
0 |
1 |
0 |
16 |
0 |
69 |
|
44 |
International Trade Com |
365 |
365 |
38 |
0 |
38 |
0 |
3 |
38 |
0 |
|
45 |
James Madison Foundation |
6 |
6 |
0 |
0 |
0 |
0 |
0 |
6 |
0 |
|
46 |
Japan-US Friendship Com |
4 |
3 |
3 |
3 |
0 |
12 |
12 |
3 |
0 |
|
47 |
Merit Systems Protect Bd |
225 |
174 |
47 |
46 |
1 |
2 |
4 |
18 |
29 |
|
48 |
Nat Aeronautics and Space Admin |
19,312 |
15,938 |
929 |
471 |
458 |
6 |
10 |
400 |
4,189 |
|
49 |
Nat Archives and Records Admin |
3,117 |
3,117 |
165 |
58 |
107 |
9 |
4 |
1,684 |
1,433 |
|
50 |
National Council on Disability |
11 |
11 |
8 |
1 |
7 |
2 |
7 |
11 |
0 |
|
51 |
Nat Credit Union Administration |
945 |
160 |
41 |
15 |
26 |
2 |
6 |
56 |
104 |
|
52 |
National Endowment for the Arts |
153 |
153 |
51 |
0 |
51 |
0 |
2 |
51 |
0 |
|
53 |
Nat Endowment for the Humanities |
170 |
170 |
55 |
15 |
40 |
4 |
2 |
55 |
0 |
|
54 |
National Labor Relations Board |
1,935 |
1,334 |
452 |
200 |
252 |
5 |
3 |
87 |
365 |
|
55 |
National Mediation Board |
52 |
52 |
15 |
14 |
1 |
4 |
1 |
50 |
2 |
|
56 |
National Science Foundation |
1,341 |
1,160 |
208 |
72 |
136 |
6 |
2 |
190 |
18 |
|
57 |
Nuclear Regulatory Commission |
3,151 |
3,005 |
876 |
174 |
702 |
4 |
1 |
657 |
219 |
|
58 |
Nuclear Waste Technical R B |
16 |
15 |
15 |
13 |
2 |
4 |
2 |
15 |
0 |
|
59 |
Occupational Safety & Health RC |
62 |
55 |
9 |
6 |
3 |
2 |
3 |
5 |
4 |
|
60 |
Office of Government Ethics |
78 |
77 |
6 |
6 |
0 |
4 |
0 |
6 |
0 |
|
61 |
Office Nat Drug Control Policy |
109 |
109 |
4 |
2 |
2 |
15 |
16 |
4 |
0 |
|
62 |
Office of Personnel Management |
3,606 |
2,898 |
1,542 |
1,226 |
316 |
5 |
2 |
537 |
1,005 |
|
63 |
Office of Special Counsel |
98 |
83 |
14 |
8 |
6 |
8 |
3 |
14 |
0 |
|
64 |
Overseas Private Invstmnt Corp |
205 |
152 |
39 |
24 |
15 |
4 |
2 |
38 |
1 |
|
|
|
|
|
|
|
|
|
|
|
|
|
65 |
Peace Corps |
916 |
0 |
0 |
0 |
0 |
0 |
0 |
0 |
0 |
|
66 |
Pension Benefit Guaranty Corp |
790 |
339 |
339 |
99 |
240 |
4 |
2 |
339 |
0 |
|
67 |
Postal Rate Commission |
47 |
6 |
6 |
0 |
6 |
0 |
1 |
6 |
0 |
|
68 |
Railroad Retirement Board |
1,132 |
317 |
119 |
74 |
45 |
5 |
2 |
0 |
119 |
|
69 |
Securities and Exchange Com |
3,279 |
3,279 |
313 |
90 |
223 |
4 |
0 |
182 |
131 |
|
70 |
Selective Service System |
166 |
166 |
2 |
2 |
0 |
2 |
|
2 |
0 |
|
71 |
Small Business Administration |
3,138 |
3,120 |
268 |
122 |
146 |
7 |
|
97 |
171 |
|
72 |
Social Security Administration |
68,743 |
14,649 |
4,375 |
4,101 |
274 |
6 |
5 |
741 |
3,634 |
|
73 |
|
13,000 |
0 |
0 |
0 |
0 |
0 |
0 |
0 |
0 |
|
74 |
Trade and Devlp Agency |
48 |
0 |
0 |
0 |
0 |
0 |
0 |
0 |
0 |
|
|
All employees |
1,749,998 |
Eligible |
Twrks |
Core T's |
Sit T's |
|
|
DC |
Ex-DC |
|
|
Totals |
|
751,844 |
102,921 |
62,438 |
40,483 |
5 |
3 |
37,080 |
84,441 |
|
|
|
|
100% |
14% |
8% |
5% |
|
|
5% |
11% |
|
|
|
|
|
|
|
|
|
|
|
|
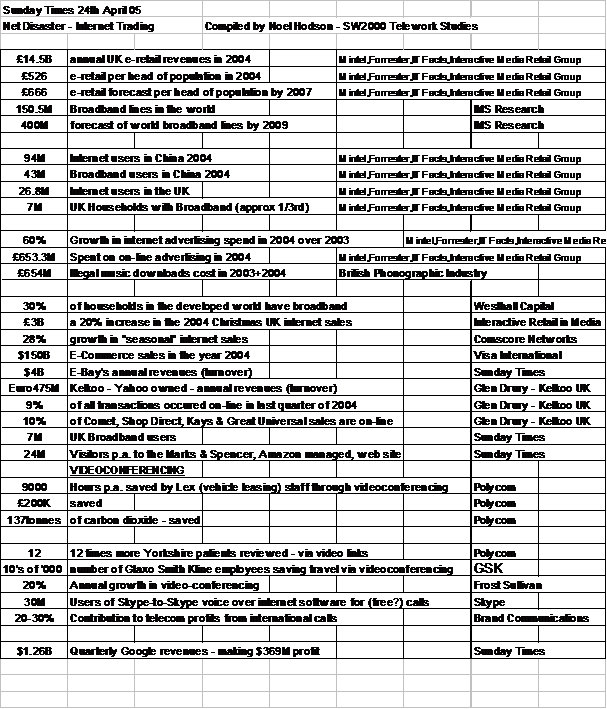
The
European Union May 2004
TIME IS MONEY - What you
contribute to your company
Telework consultants cite time saved for productive work as the largest single benefit. These two tables indicate one method of valuing your business time – compared to sample results from public companies.
The contribution to the "top-line" is equally valid for people in non-profit making organisations. Most large organisations earn net profits after all costs, overheads and taxes of 5%-10%, so there is only that degree of difference when calculating the personal contribution of civil servants and charitable agencies workers to their employers’ organisations. And no employers hire and retain people who are not making a valuable contribution to the team - there are few passengers inside the modern corporate system.
TIME IS MONEY
- Employee Value in some UK
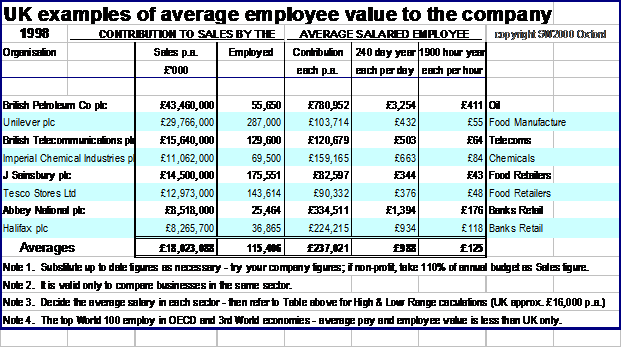
|
|
|
|
|||
|
|
|
|
|||